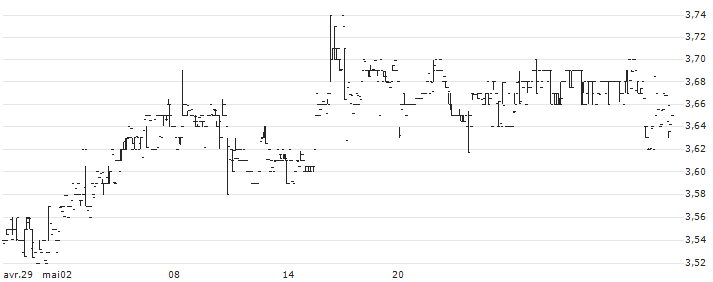
|
Temps réel estimé
Cboe BZX
19:01:15 03/05/2024
|
Varia. 5j.
|
Varia. 1 janv.
|
|
3,595
USD
|
+0,56%
|
 |
+1,67%
|
-0,35%
|

| |
29/04/2024
|
30/04/2024
|
01/05/2024
|
02/05/2024
|
03/05/2024
|
| Dernier |
3.53 $
|
3.52 $
|
3.53 $
|
3.575 $
|
3,588
$
|
| Volume |
32 733 |
28 512 |
16 985 |
20 244 |
20 708 |
| Variation |
+0,04%
|
-0,28%
|
+0,28%
|
+1,27%
|
+0,56%
|
| Ouverture |
3.51 |
3.53 |
3.52 |
3.54 |
3,62
|
| Plus haut |
3.56 |
3.56 |
3.57 |
3.59 |
3,62
|
| Plus bas |
3.51 |
3.52 |
3.52 |
3.54 |
3,56
|
Volume du jour estimé
39 518
Volume moy. 20 séances
34 874
Ratio Volume du jour
1.13
Volume moy. 20 séances USD
125 372.03
Volume record 1
25 700 000
Rotation capital moyenne
0.00
Rotation flottant moyenne
0.00
Capitalisation (USD)
69 249 119
Chiffre d'affaires (USD)
4 295 551
Capitalisation flottante (USD)
66 999 750
Capital Moyen Quotidien Echangé
0.18%
Moyenne mobile 5 jours
3.53
Moyenne mobile 20 jours
3.53
Moyenne mobile 50 jours
3.61
Moyenne mobile 100 jours
3.61
Ecart cours / (MMA5) -1,68% Ecart cours / (MMA20) -1,73% Ecart cours / (MMA50) +0,48% Ecart cours / (MMA100) +0,52% | Nom |
Varia.
|
Varia. 5j.
|
Varia. 1 janv.
|
Varia. 1an
|
Capi.
|
|---|
| | +0,56% | +1,67% | -0,35% | -18,28% | 69,25 M | | | +0,37% | -0,89% | +2,82% | +13,85% | 12,46 Md | | | +2,59% | +5,01% | +10,78% | +48,55% | 9,22 Md | | | -0,96% | +7,46% | +10,08% | +95,54% | 5,69 Md | | | +0,65% | -0,65% | -3,84% | +6,04% | 5,35 Md | | | +0,49% | +1,82% | +7,55% | +6,42% | 5,26 Md | | | -0,72% | -3,35% | +10,52% | +1,94% | 4,36 Md | | | -0,52% | -2,20% | +14,11% | +8,14% | 4,36 Md | | | +0,24% | +0,08% | +1,77% | +2,01% | 4,02 Md | | | +0,75% | +3,52% | +5,13% | +4,32% | 3,87 Md | | | +0,51% | +1,03% | -2,36% | -2,98% | 3,19 Md | | | 0,00% | -1,53% | +2,65% | -18,34% | 3,16 Md | | | -0,70% | +1,02% | -12,57% | -23,46% | 3,11 Md | | | +0,49% | -1,45% | -11,83% | -20,44% | 3,09 Md | | | +0,94% | +1,81% | -0,25% | +1,03% | 2,49 Md | | | +0,86% | +0,38% | +6,59% | +16,80% | 2,49 Md | | Moyenne | +0,36% | +1,14% | +2,55% | +7,57% | | | Moyenne pondérée par Capi. | +0,48% | +1,37% | +3,97% | +15,77% | |
f92e910999da0d3fe3debf115bff88._RJ0uyexzRRnbZNrx_ZmkBNv0QxDlvQIJyebr_sbs9w.jGUGw1PZ4CQQVfYYq4QT-VAd4jga-bFtUAr65ZB80J-uPzeMTfm5ciFdpw | Date | Cours | Volume | Volume du jour |
|---|
|
18:31:33 |
3,588
|
1 500 |
20 539 | |
18:15:49 |
3,578
|
1 130 |
19 039 | |
18:10:12 |
3,58
|
200 |
17 909 | |
18:06:45 |
3,59
|
700 |
17 709 | |
17:47:35 |
3,57
|
1 401 |
17 009 | |
17:43:01 |
3,56
|
400 |
15 608 | |
17:15:17 |
3,57
|
272 |
15 208 | |
17:11:12 |
3,566
|
3 900 |
14 936 | |
17:10:43 |
3,57
|
300 |
11 036 | |
17:10:43 |
3,57
|
168 |
10 736 |
| 
