








Société Y.D. More Investments Ltd
Actions
MRIN
IL0011414641
Gestion des placements et exploitants de fonds
|
Marché Fermé -
TEL AVIV STOCK EXCHANGE
12:49:12 06/11/2026
|
Varia. 5j. | Varia. 1 janv. | ||
| 3 758,00 ILa | +3,78% |
|
-1,11% | -33,49% |
Description de l'Activité: Y.D. More Investments Ltd

Nombre d'employés: 408
Répartition des Ventes par Activité: Y.D. More Investments Ltd
| Période Fiscale: Décembre | 2021 (ILS) | 2022 (ILS) | 2023 (ILS) | 2024 (ILS) | 2025 (ILS) |
|---|---|---|---|---|---|
Management of Provident and Pension Funds | 135 M | 275 M | 435 M | 515 M | 647 M |
Mutual Fund Management | 164 M | 177 M | 167 M | 215 M | 318 M |
Investment Portfolio Management | 22,5 M | 28,22 M | 28,52 M | 32,47 M | 43,96 M |
Other Segments | 4,56 M | 29,82 M | 33,78 M | 36,49 M | 24,9 M |
Unallocated Other Income | 533 k | 2,48 M | 5,67 M | - | 1,74 M |
Unallocated The Company's Share in The Losses of a Company Accounted for under The Equity Method | -365 k | -257 k | - | - | - |
Brokerage Transactions | 31,91 M | - | - | - | - |
Consolidation Adjustments | -11,41 M | -14,52 M | -19,61 M | -14,86 M | -22,11 M |
Répartition Géographique des Ventes: Y.D. More Investments Ltd
| Période Fiscale: Décembre | 2021 (ILS) | 2022 (ILS) | 2023 (ILS) | 2024 (ILS) | 2025 (ILS) |
|---|---|---|---|---|---|
Israel | 347 M | 498 M | 650 M | 786 M | 1,01 Md |
Comité Exécutif: Y.D. More Investments Ltd
| Dirigeant | Titre | Age | Depuis |
|---|---|---|---|
Eli Levy
CEO | Directeur Général | 43 | 01/01/2020 |
Yosef Levy
CEO | Directeur Général | 68 | 24/05/2006 |
Oranit Shaia
DFI | Directeur Financier/CFO | 56 | 13/01/2014 |
Liat Davidov
CIO | Directeur en chef des Investissements | 49 | 11/01/2019 |
Roy Mizrahi
CTO | Directeur Technique/Scientifique/R&D | 56 | 24/03/2021 |
Composition du Conseil d'Administration: Y.D. More Investments Ltd
| Administrateur | Titre | Age | Depuis |
|---|---|---|---|
| Directeur/Membre du Conseil | 56 | 24/07/2017 | |
Yaron Blum
BRD | Directeur/Membre du Conseil | 67 | 29/07/2020 |
Benjamin Meirov
CHM | Président | 74 | 23/02/2014 |
Meir Gridish
CHM | Président | 53 | 01/08/2015 |
Yosef Levy
BRD | Directeur/Membre du Conseil | 68 | 24/05/2006 |
Eli Levy
BRD | Directeur/Membre du Conseil | 43 | 13/02/2017 |
| Directeur/Membre du Conseil | 53 | 24/07/2022 |
Participations: Y.D. More Investments Ltd
| Nom | Actions | % | Valorisation |
|---|---|---|---|
| 85 000 000 | 66,22% | 451 M $ | |
| 630 865 | 5,13% | 69 M $ | |
| 7 847 402 | 5,16% | 34 M $ | |
REIT 1 LTD 1,93% | 3 912 457 | 1,93% | 25 M $ |
TIDHAR GROUP LTD. 0,9% | 458 080 | 0,9% | 23 M $ |
TAT TECHNOLOGIES LTD. 4,75% | 617 933 | 4,75% | 22 M $ |
| 218 181 | 0,16% | 15 M $ | |
ECONERGY LTD 0,54% | 416 156 | 0,54% | 8 M $ |
CARASSO MOTORS LTD. 0,9% | 856 562 | 0,9% | 7 M $ |
TIV TAAM HOLDINGS 1 LTD. 1,67% | 1 778 299 | 1,67% | 7 M $ |
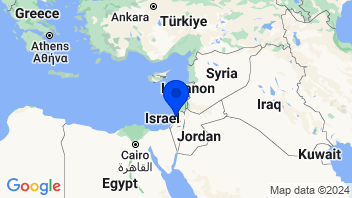
Coordonnées de la Société: Y.D. More Investments Ltd
Sociétés du Groupe: Y.D. More Investments Ltd
| Nom | Catégorie et Secteur |
|---|---|
Investment Managers
|
Gestion des placements
Ajouter à une liste 0 sélectionné | Varia. | Varia. 5j. | Varia. 1an | Varia. 3ans | Capi.($) | |
|---|---|---|---|---|---|---|
 | +3,78% | -1,11% | -16,49% | +431,39% | 860 M | |
| +0,70% | +2,73% | +8,93% | +79,99% | 182 Md | |
| -0,88% | +0,76% | +30,28% | +76,91% | 146 Md | |
| +0,16% | +0,41% | +34,73% | +228,49% | 99,4 Md | |
| -0,27% | +0,84% | -18,12% | +20,51% | 95,57 Md | |
| -0,05% | +6,56% | -9,04% | +97,71% | 92,59 Md | |
| -1,85% | +2,21% | -20,47% | +54,59% | 86,6 Md | |
| +1,64% | +10,89% | +0,61% | +76,25% | 84,8 Md | |
| -0,44% | +0,79% | -11,80% | +37,73% | 68,93 Md | |
| +0,20% | -2,48% | +39,94% | +148,74% | 45,05 Md | |
| Moyenne | +0,30% | +1,85% | +3,86% | +125,23% | 90,2 Md | |
| Moyenne pondérée par Capi. | -0,06% | +2,42% | +6,86% | +89,12% |


- Bourse
- Actions
- Action MRIN
- Société Y.D. More Investments Ltd
Sélectionnez votre édition
Toutes les informations financières adaptées au niveau national


