








|
Marché Fermé -
Nasdaq Stockholm
18:00:00 11/11/2026
|
Varia. 5j. | Varia. 1 janv. | ||
| 12,20 SEK | -1,21% |
|
+1,24% | +11,93% |
| 22/10 | Transcript : Nimbus Group AB, Q3 2026 Earnings Call, Oct 22, 2026 | |
| 22/10 | Nimbus Group AB (Publ) publie ses résultats pour le troisième trimestre et les neuf mois clos le 30 septembre 2026 | CI |
Description de l'Activité: Nimbus Group AB

Nombre d'employés: 239
Répartition des Ventes par Activité: Nimbus Group AB
| Période Fiscale: Décembre | 2021 (SEK) | 2022 (SEK) | 2023 (SEK) | 2024 (SEK) | 2025 (SEK) |
|---|---|---|---|---|---|
Sale of Boats | 1,35 Md | 1,62 Md | 1,77 Md | 1,5 Md | 1,26 Md |
Sale of Accessories | 56,77 M | 54,84 M | 58 M | 52,16 M | 58,84 M |
Sale of Service | 28,48 M | 40,66 M | 37,72 M | 46,58 M | 43,53 M |
Other | 17,56 M | 32,41 M | 31,04 M | 17,48 M | 2,69 M |
Répartition Géographique des Ventes: Nimbus Group AB
| Période Fiscale: Décembre | 2021 (SEK) | 2022 (SEK) | 2023 (SEK) | 2024 (SEK) | 2025 (SEK) |
|---|---|---|---|---|---|
Sweden | 790 M | 724 M | - | - | 430 M |
Europe, Excluding The Nordic Countries | 276 M | 467 M | 467 M | 338 M | 406 M |
North America | - | - | 152 M | 567 M | 365 M |
The Nordic Countries, Excluding Sweden | - | - | - | - | 150 M |
Other Markets | 159 M | 228 M | 76,88 M | 64,26 M | 16,12 M |
Nordics | 231 M | 331 M | 1,06 Md | 649 M | - |
Comité Exécutif: Nimbus Group AB
| Dirigeant | Titre | Age | Depuis |
|---|---|---|---|
Johan Inden
CEO | Directeur Général | 52 | 01/09/2025 |
| Directeur Financier/CFO | 63 | 01/03/2026 | |
Jakob Brandstedt
COO | Directeur des opérations | 38 | 01/01/2007 |
Mats Jacobsson
CTO | Directeur Technique/Scientifique/R&D | 60 | 01/01/2009 |
Gunilla Öhman
IRC | Investor Relations Contact | 67 | 01/11/2020 |
Composition du Conseil d'Administration: Nimbus Group AB
| Administrateur | Titre | Age | Depuis |
|---|---|---|---|
| Directeur/Membre du Conseil | 55 | 01/01/2012 | |
| Président | 71 | 01/01/2020 | |
Lars Hygrell
BRD | Directeur/Membre du Conseil | 62 | 01/01/2020 |
Göran Gummesson
BRD | Directeur/Membre du Conseil | 79 | 01/01/2012 |
Eva Nilsagård
BRD | Directeur/Membre du Conseil | 62 | 01/01/2020 |
Johanna Lundberg
BRD | Directeur/Membre du Conseil | 50 | 01/01/2023 |
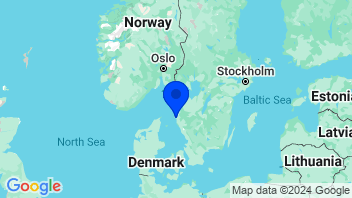
Coordonnées de la Société: Nimbus Group AB
Voiliers et bateaux à moteur
Ajouter à une liste 0 sélectionné | Varia. | Varia. 5j. | Varia. 1an | Varia. 3ans | Capi.($) | |
|---|---|---|---|---|---|---|
 | -1,21% | +1,24% | +15,64% | -42,45% | 53,2 M | |
| -0,35% | +2,62% | +33,10% | -3,94% | 11,58 Md | |
| -0,81% | +4,12% | -13,29% | -34,72% | 7,77 Md | |
| +0,45% | +4,08% | +198,58% | - | 7,87 Md | |
| -0,05% | +0,37% | +22,53% | +11,37% | 5,04 Md | |
| -1,33% | -4,02% | +4,08% | +55,17% | 4,86 Md | |
| -0,29% | +7,15% | +4,53% | -3,81% | 4,69 Md | |
| -1,46% | +1,23% | -23,18% | -14,19% | 4,1 Md | |
| -0,36% | -1,38% | -17,63% | +10,83% | 4,11 Md | |
| -0,75% | -1,23% | -41,10% | -0,15% | 3,82 Md | |
| Moyenne | -0,57% | +2,40% | +18,33% | -2,43% | 5 Md | |
| Moyenne pondérée par Capi. | -0,38% | +3,14% | +31,05% | -0,53% |
Secteur

Bénéfices annuels - Taux de surprise


- Bourse
- Actions
- Action BOAT
- Société Nimbus Group AB
Sélectionnez votre édition
Toutes les informations financières adaptées au niveau national


