








|
Marché Fermé -
OTC Markets
18:58:39 09/04/2026
|
Varia. 5j. | Varia. 1 janv. | ||
| 0,000001 USD | -99,80% |
|
-.--% | - |
Description de l'Activité: Komo Plant Based Foods Inc.

Répartition des Ventes par Activité: Komo Plant Based Foods Inc.
| Période Fiscale: Juillet | 2019 (CAD) | 2020 (CAD) | 2021 (CAD) | 2022 (CAD) | 2023 (CAD) |
|---|---|---|---|---|---|
Plant-Based Comfort Foods | - | - | - | 650 k | - |
Répartition Géographique des Ventes: Komo Plant Based Foods Inc.
| Période Fiscale: Juillet | 2019 (CAD) | 2020 (CAD) | 2021 (CAD) | 2022 (CAD) | 2023 (CAD) |
|---|---|---|---|---|---|
Canada | - | - | 62,84 k | 650 k | - |
Comité Exécutif: Komo Plant Based Foods Inc.
| Dirigeant | Titre | Age | Depuis |
|---|---|---|---|
Yu Cai Huang
DFI | Directeur Financier/CFO | 58 | 01/02/2021 |
| Sales & Marketing | - | 26/05/2022 |
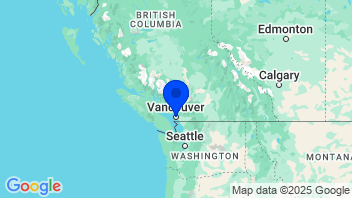
Coordonnées de la Société: Komo Plant Based Foods Inc.
Komo Plant Based Foods, Inc.
1605 West 5th Avenue
V6J 1N5, Vancouver
+
Fabrication d'aliments végétaliens et végétariens
Ajouter à une liste 0 sélectionné | Varia. | Varia. 5j. | Varia. 1an | Varia. 3ans | Capi.($) | |
|---|---|---|---|---|---|---|
 | -99,80% | -.--% | - | - | 11 | |
| +0,06% | +1,23% | +9,09% | -15,68% | 264 Md | |
| +3,85% | +1,79% | +13,02% | -2,81% | 82,2 Md | |
| +0,67% | +6,39% | -14,03% | +15,50% | 47,06 Md | |
| -.--% | +0,73% | +18,04% | +544,79% | 45,83 Md | |
| +0,93% | -4,03% | +27,06% | +7,76% | 37,07 Md | |
| +3,33% | -2,38% | -2,37% | -11,84% | 33,28 Md | |
| +0,20% | +2,29% | +15,55% | +81,81% | 31,02 Md | |
| +0,96% | +0,96% | -8,53% | -6,16% | 30 Md | |
| +1,84% | -1,85% | -1,58% | -24,41% | 28,86 Md | |
| Moyenne | -8,79% | -0,07% | +6,25% | +65,44% | 59,98 Md | |
| Moyenne pondérée par Capi. | +1,00% | +0,63% | +7,91% | +38,12% |

- Bourse
- Actions
- Action KOMOF
- Société Komo Plant Based Foods Inc.
Sélectionnez votre édition
Toutes les informations financières adaptées au niveau national


