








Instrument Inactif
Société Chinook Tyee Industry Ltd Toronto S.E.
Actions
GBI.H
CA16961T2083
Sociétés holdings
Description de l'Activité: Chinook Tyee Industry Ltd

Répartition des Ventes par Activité: Chinook Tyee Industry Ltd
| Période Fiscale: Décembre | 2020 (EUR) | 2021 (EUR) | 2022 (EUR) | 2023 (EUR) | 2024 (EUR) |
|---|---|---|---|---|---|
Unclassified Services | 105 k | 453 k | - | - | - |
Comité Exécutif: Chinook Tyee Industry Ltd
| Dirigeant | Titre | Age | Depuis |
|---|---|---|---|
Tom Kusumoto
CEO | Directeur Général | 56 | 14/12/2012 |
Composition du Conseil d'Administration: Chinook Tyee Industry Ltd
| Administrateur | Titre | Age | Depuis |
|---|---|---|---|
| Directeur/Membre du Conseil | 74 | 05/12/2018 | |
Frank Otto
BRD | Directeur/Membre du Conseil | - | 11/05/2022 |
Oliver Schindler
BRD | Directeur/Membre du Conseil | - | 02/12/2022 |
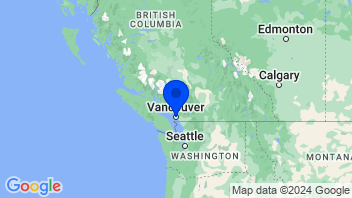
Coordonnées de la Société: Chinook Tyee Industry Ltd
Sociétés holdings - Autres
Ajouter à une liste 0 sélectionné | Varia. | Varia. 5j. | Varia. 1an | Varia. 3ans | Capi.($) | |
|---|---|---|---|---|---|---|
 | -0,44% | -1,89% | +37,38% | +98,77% | 132 Md | |
| -0,48% | -5,57% | +39,43% | +84,12% | 23,66 Md | |
| +0,12% | -1,69% | +26,95% | +44,25% | 17,03 Md | |
| -0,09% | -4,36% | +14,55% | +24,40% | 14,37 Md | |
| -1,60% | -5,51% | -3,39% | +134,81% | 13,47 Md | |
| -0,43% | -1,44% | -22,10% | +63,10% | 13,22 Md | |
| +1,85% | +8,74% | +81,14% | +90,80% | 13,9 Md | |
| -0,51% | -2,31% | -22,72% | -4,15% | 12,76 Md | |
| -0,68% | -3,41% | +6,41% | +41,62% | 12,31 Md | |
| Moyenne | -0,28% | -2,10% | +17,52% | +64,19% | 28,07 Md | |
| Moyenne pondérée par Capi. | -0,37% | -2,15% | +28,15% | +81,13% |


