








Instrument Inactif
Société Superior Drilling Products, Inc.
Actions
SDPI
US8681531070
Pétrole et gaz - Equipements et services pétroliers
Description de l'Activité: Superior Drilling Products, Inc.

Nombre d'employés: 75
Répartition des Ventes par Activité: Superior Drilling Products, Inc.
| Période Fiscale: Décembre | 2019 (USD) | 2020 (USD) | 2021 (USD) | 2022 (USD) | 2023 (USD) |
|---|---|---|---|---|---|
Oil Well Equipment & Services | 19 M | 10,47 M | 13,34 M | 19,1 M | 20,97 M |
Répartition Géographique des Ventes: Superior Drilling Products, Inc.
| Période Fiscale: Décembre | 2019 (USD) | 2020 (USD) | 2021 (USD) | 2022 (USD) | 2023 (USD) |
|---|---|---|---|---|---|
United States | 17,67 M | - | - | 16,77 M | 17,84 M |
Mexico | - | - | - | 145 k | 69 k |
Middle East | 1,33 M | - | - | - | - |
International | - | 1,88 M | 1,72 M | 2,18 M | - |
North America | - | 8,59 M | 11,62 M | - | - |
Comité Exécutif: Superior Drilling Products, Inc.
| Dirigeant | Titre | Age | Depuis |
|---|---|---|---|
Gilbert Meier
CEO | Directeur Général | 45 | - |
| Directeur Financier/CFO | 70 | 01/03/2014 | |
David Gale
PRN | Corporate Officer/Principal | - | - |
Composition du Conseil d'Administration: Superior Drilling Products, Inc.
| Administrateur | Titre | Age | Depuis |
|---|---|---|---|
Gilbert Meier
BRD | Directeur/Membre du Conseil | 45 | - |
Coordonnées de la Société: Superior Drilling Products, Inc.
Superior Drilling Products, Inc.
1583 South 1700 East
84078-9802, Vernal
+(435) 789-0594
http://www.sdpi.com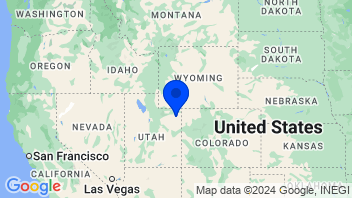
Equipements liés au pétrole
Ajouter à une liste 0 sélectionné | Varia. | Varia. 5j. | Varia. 1an | Varia. 3ans | Capi.($) | |
|---|---|---|---|---|---|---|
 | -0,34% | -3,61% | +40,82% | -8,33% | 76,95 Md | |
| -0,49% | -10,53% | +8,53% | +50,01% | 52,42 Md | |
| -2,42% | -4,02% | +45,91% | +57,86% | 29,11 Md | |
| -1,56% | -4,35% | +25,35% | -15,44% | 28,18 Md | |
| -0,19% | -6,50% | +58,53% | +199,96% | 25,95 Md | |
| -8,36% | -8,58% | +61,57% | +176,79% | 12,51 Md | |
| -1,19% | -4,08% | +72,44% | +113,04% | 10,05 Md | |
| -1,43% | -4,32% | +91,06% | +194,03% | 9,42 Md | |
| -1,02% | -10,02% | +22,86% | -9,10% | 6,59 Md | |
| Moyenne | -1,89% | -6,48% | +47,45% | +84,31% | 27,91 Md | |
| Moyenne pondérée par Capi. | -1,23% | -5,93% | +38,47% | +53,88% |


