








|
Marché Fermé -
Nasdaq Stockholm
18:00:00 06/11/2026
|
Varia. 5j. | Varia. 1 janv. | ||
| 62,50 SEK | -2,04% |
|
-1,73% | - |
Répartition des Ventes par Activité: Salix Group AB
| Période Fiscale: Décembre | 2023 (SEK) | 2024 (SEK) | 2025 (SEK) |
|---|---|---|---|
Consumables Trade & Agriculture | 1,23 Md | 1,43 Md | 1,54 Md |
Home & Fittings | 970 M | 1,09 Md | 1,51 Md |
Construction & Packaging Solutions | 1,23 Md | 1,1 Md | 1,1 Md |
Elimination between Business Areas | -25 M | -26 M | -27 M |
Répartition Géographique des Ventes: Salix Group AB
| Période Fiscale: Décembre | 2023 (SEK) | 2024 (SEK) | 2025 (SEK) |
|---|---|---|---|
Sweden | 2,43 Md | 2,65 Md | 2,82 Md |
Norway | 551 M | 527 M | 525 M |
Denmark | 78 M | 100 M | 466 M |
Finland | 304 M | 279 M | 268 M |
Estonia | 13 M | 12 M | 11 M |
China | 6 M | 7 M | 11 M |
Lithuania | 9 M | 8 M | 8 M |
Latvia | 8 M | 7 M | 7 M |
Comité Exécutif: Salix Group AB
| Dirigeant | Titre | Age | Depuis |
|---|---|---|---|
Martin Hansson
CEO | Directeur Général | 51 | 01/09/2021 |
Carolina Nerman
DFI | Directeur Financier/CFO | 46 | 01/01/2024 |
Christos Selman
PRN | Corporate Officer/Principal | 35 | 01/01/2024 |
Fredrick Sylva
PRN | Corporate Officer/Principal | 55 | 01/01/2018 |
Roger Andersson
PRN | Corporate Officer/Principal | 61 | 01/01/2021 |
Composition du Conseil d'Administration: Salix Group AB
| Administrateur | Titre | Age | Depuis |
|---|---|---|---|
| Président | 57 | 01/01/2025 | |
Andreas Stenbäck
BRD | Directeur/Membre du Conseil | 47 | 01/02/2019 |
| Directeur/Membre du Conseil | 58 | 01/01/2026 | |
Maria Edsman
BRD | Directeur/Membre du Conseil | 58 | 01/01/2026 |
Mattias Björk
BRD | Directeur/Membre du Conseil | 51 | 01/01/2025 |
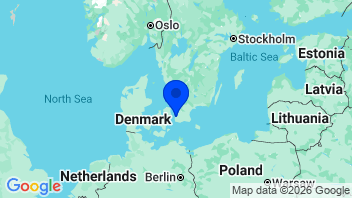
Coordonnées de la Société: Salix Group AB
Vente en gros de machines et équipements industriels
Ajouter à une liste 0 sélectionné | Varia. | Varia. 5j. | Varia. 1an | Varia. 3ans | Capi.($) | |
|---|---|---|---|---|---|---|
 | -2,04% | -1,73% | - | - | 516 M | |
| +2,86% | +2,00% | +8,74% | +125,46% | 116 Md | |
| -0,62% | +0,11% | +18,47% | +23,23% | 87,19 Md | |
| -0,74% | +6,00% | +50,85% | +86,39% | 67,45 Md | |
| +0,17% | +2,08% | +29,72% | +79,57% | 60,8 Md | |
| +4,42% | -11,42% | +50,46% | +117,67% | 46,33 Md | |
| -0,07% | +6,98% | +58,62% | +91,15% | 33,24 Md | |
| +1,39% | +3,67% | +7,08% | +25,78% | 31,87 Md | |
| -6,03% | -6,87% | +4,98% | +34,82% | 31,03 Md | |
| +0,64% | -1,87% | +13,04% | +56,24% | 27,11 Md | |
| Moyenne | -0,00% | -0,85% | +26,88% | +71,15% | 50,13 Md | |
| Moyenne pondérée par Capi. | +0,63% | -0,90% | +25,72% | +78,12% |
Secteur


Chiffre d'affaires trimestriel - Taux de surprise


- Bourse
- Actions
- Action SALIX
- Société Salix Group AB
Sélectionnez votre édition
Toutes les informations financières adaptées au niveau national


