








Description de l'Activité: Isra Vision AG

Nombre d'employés: 827
Répartition des Ventes par Activité: Isra Vision AG
| Période Fiscale: Septembre | 2019 (EUR) | 2020 (EUR) |
|---|---|---|
Surface Vision | 115 M | 93,63 M |
Industrial Automation | 39,13 M | 35,68 M |
Répartition Géographique des Ventes: Isra Vision AG
| Période Fiscale: Septembre | 2019 (EUR) | 2020 (EUR) |
|---|---|---|
China | 49,82 M | 40,81 M |
Europe | 31,06 M | 26,98 M |
Germany | 26,16 M | 24,48 M |
Asia, Rest of The World Excluding China | 19,45 M | 17,8 M |
United States | 20,73 M | 14,6 M |
America Excluding United States | 6,69 M | 4,64 M |
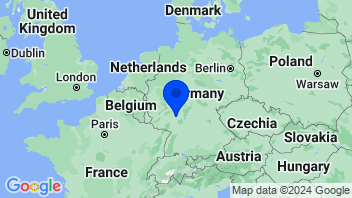
Coordonnées de la Société: Isra Vision AG
Logiciel d'application
Ajouter à une liste 0 sélectionné | Varia. | Varia. 5j. | Varia. 1an | Varia. 3ans | Capi.($) | |
|---|---|---|---|---|---|---|
 | +0,17% | -2,25% | +2,49% | +41,72% | 3 884 Md | |
| -2,09% | +8,39% | -8,79% | +754,04% | 413 Md | |
| -1,38% | +8,85% | -44,78% | +10,86% | 396 Md | |
| +0,42% | -1,07% | -2,27% | +58,28% | 271 Md | |
| -0,13% | +2,41% | +53,42% | +154,22% | 264 Md | |
| -1,42% | +4,33% | +66,06% | +361,74% | 236 Md | |
| +3,92% | +14,88% | -30,05% | +834,23% | 130 Md | |
| +1,58% | -0,11% | -40,83% | -19,46% | 104 Md | |
| -1,79% | +3,84% | +54,88% | +150,33% | 95,17 Md | |
| Moyenne | -0,25% | +3,72% | +5,57% | +260,66% | 644 Md | |
| Moyenne pondérée par Capi. | -0,24% | +0,33% | +2,48% | +127,87% |


