








Instrument Inactif
Société Denbury Inc.
Actions
DEN
US24790A1016
Pétrole et gaz - exploration / production
Description de l'Activité: Denbury Inc.

Nombre d'employés: 811
Répartition des Ventes par Activité: Denbury Inc.
| Période Fiscale: Décembre | 2019 (USD) | 2020 (USD) | 2021 (USD) | 2022 (USD) |
|---|---|---|---|---|
Oil and Gas Exploration | 1,27 Md | 751 M | 1,26 Md | 1,71 Md |
Répartition Géographique des Ventes: Denbury Inc.
| Période Fiscale: Décembre | 2019 (USD) | 2020 (USD) | 2021 (USD) | 2022 (USD) |
|---|---|---|---|---|
United States | 1,27 Md | 751 M | 1,26 Md | 1,71 Md |
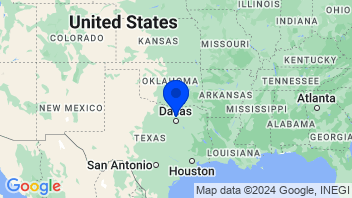
Coordonnées de la Société: Denbury Inc.
Sociétés du Groupe: Denbury Inc.
| Nom | Catégorie et Secteur |
|---|---|
Denbury Onshore LLC
 Denbury Onshore LLC Oil & Gas ProductionEnergy Minerals Explores oil and gas properties |
Oil & Gas Production
|
Pétrole et gaz - exploration / production - Autres
Ajouter à une liste 0 sélectionné | Varia. | Varia. 5j. | Varia. 1an | Varia. 3ans | Capi.($) | |
|---|---|---|---|---|---|---|
 | -1,08% | -9,71% | +54,46% | +13,12% | 163 Md | |
| -1,04% | -11,12% | +52,14% | +49,60% | 101 Md | |
| -1,48% | -10,68% | +37,74% | +13,05% | 76 Md | |
| +0,31% | +3,83% | -4,69% | -1,52% | 67,67 Md | |
| -1,69% | -10,55% | +41,79% | -10,55% | 56,34 Md | |
| -2,65% | -9,99% | +30,15% | +29,04% | 54,38 Md | |
| -2,27% | -13,90% | +65,71% | +48,28% | 50,07 Md | |
| -1,80% | -13,01% | +30,80% | +10,78% | 50,13 Md | |
| -2,81% | -16,20% | +32,59% | -9,42% | 49,31 Md | |
| Moyenne | -1,61% | -10,03% | +37,85% | +15,82% | 74,17 Md | |
| Moyenne pondérée par Capi. | -1,43% | -9,71% | +40,61% | +17,24% |


