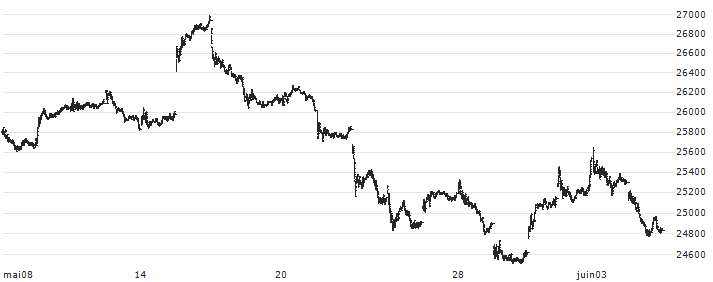
Cotations Dow Jones U.S. Select Home Construction Total Return Index

Indice

DJSHMBT

Marché Fermé - USA 23:35:48 09/05/2024 Varia. 5j. Varia. 1 janv.
26 042 PTS +1,56% Graphique intraday de Dow Jones U.S. Select Home Construction Total Return Index +2,51% +5,20%
Mois en cours+4,32%
1 mois-2,99%

Cotations 5 jours

Temps réel USA
Dow Jones U.S. Select Home Construction Total Return Index(DJSHMBT) : Graphique de Cours (5 jours)
  06/05/2024 07/05/2024 08/05/2024 09/05/2024
Dernier 26174.34 PTS 25926.65 PTS 25640.75 PTS 26041.8 PTS
Variation +1,47% -0,95% -1,10% +1,56%

Performances

1 semaine+2,67%
Mois en cours+4,32%
1 mois-2,99%
3 mois+5,23%
6 mois+35,64%
Année en cours+6,84%
1 an+43,93%
3 ans+45,26%
5 ans+200,06%
10 ans+412,72%

Extrêmes de cours

1 semaine
25 602.62
Extrême 25602.62
26 502.53
1 mois
24 428.83
Extrême 24428.83
26 502.53
3 ans
11 318.72
Extrême 11318.72
27 939.13
5 ans
5 151.77
Extrême 5151.77
27 939.13
10 ans
4 670.82
Extrême 4670.82
27 939.13

Indicateurs

Moyenne mobile 5 jours
25 780.00
Moyenne mobile 20 jours
25 315.01
Moyenne mobile 50 jours
26 054.60
Moyenne mobile 100 jours
25 270.70
Ecart cours / (MMA5)
-1,01%
Ecart cours / (MMA20)
-2,79%
Ecart cours / (MMA50)
+0,05%
Ecart cours / (MMA100)
-2,96%
RSI 9 jours
57.30
RSI 14 jours
53.48
Heatmap détaillée

Données historiques

DateOuverturePlus hautPlus basClôtureVolume
Graphique Dow Jones U.S. Select Home Construction Total Return Index
Plus de graphiques

Variations mensuelles

Variations annuelles

2024+6,84%
2023+69,57%
2022-25,92%
2021+49,77%
2020+26,99%
2019+49,60%
2018-30,73%
2017+60,15%
2016+2,22%
2015+5,45%
2014+5,15%
2013+18,41%
2012+78,10%
2011-8,09%
2010+10,86%
2009+31,55%
2008-44,53%
2007-57,30%
  1. Bourse
  2. Indices
  3. Dow Jones U.S. Select Home Construction Total Return Index - Etats-Unis
  4. Cotations Dow Jones U.S. Select Home Construction Total Return Index