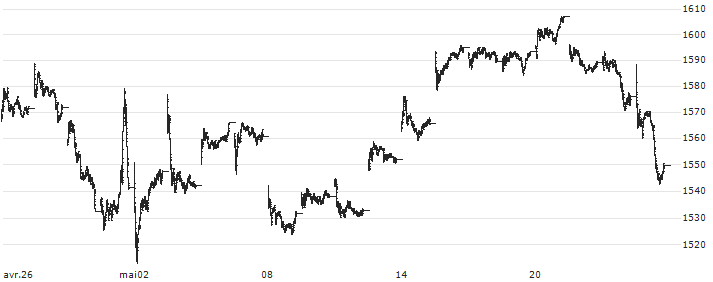
|
Marché Fermé -
Nasdaq
23:16:15 30/04/2024
|
Varia. 5j.
|
Varia. 1 janv.
|
|
1 533
PTS
|
-2,49%
|
 |
+3,12%
|
-6,03%
|
| Mois en cours | -8,26% | | | | 1 mois | -8,26% | | |

| |
25/04/2024
|
26/04/2024
|
29/04/2024
|
30/04/2024
|
| Dernier |
1547.899521 PTS
|
1571.636406 PTS
|
1571.769967 PTS
|
1532.560564 PTS
|
| Variation |
-1,09%
|
+1,53%
|
+0,01%
|
-2,49%
|
Moyenne mobile 5 jours
1 563.90
Moyenne mobile 20 jours
1 578.57
Moyenne mobile 50 jours
1 637.22
Moyenne mobile 100 jours
1 642.73
Ecart cours / (MMA5) +2,05% Ecart cours / (MMA20) +3,00% Ecart cours / (MMA50) +6,83% Ecart cours / (MMA100) +7,19%
We are working hard...

- We are working hard to come back as soon as possible.
- Nous travaillons dur pour revenir au plus vite.
- Wir arbeiten hart daran, so schnell wie möglich zurückzukommen
- Estamos trabajando duro para volver lo antes posible.
- Stiamo lavorando sodo per tornare il prima possibile.
- Wij werken hard om zo snel mogelijk weer terug te zijn.
500 error
Voir le palmarès
| 

 BVP NASDAQ EMERGING CLOUD TR INDEX
