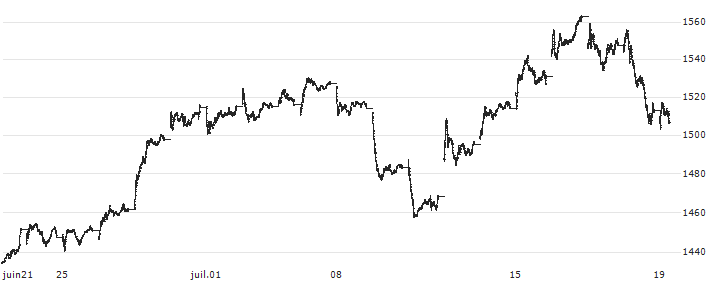
|
Marché Fermé -
Nasdaq
23:16:15 30/04/2024
|
Varia. 5j.
|
Varia. 1 janv.
|
|
1 532
PTS
|
-2,49%
|
 |
+3,12%
|
-6,03%
|
| 1 mois | -8,26% | | | | 3 mois | -10,31% | | |

| |
25/04/2024
|
26/04/2024
|
29/04/2024
|
30/04/2024
|
| Dernier |
1546.97411 PTS
|
1570.696804 PTS
|
1570.830285 PTS
|
1531.644324 PTS
|
| Variation |
-1,09%
|
+1,53%
|
+0,01%
|
-2,49%
|
Moyenne mobile 5 jours
1 562.97
Moyenne mobile 20 jours
1 577.62
Moyenne mobile 50 jours
1 636.26
Moyenne mobile 100 jours
1 641.79
Ecart cours / (MMA5) +2,05% Ecart cours / (MMA20) +3,00% Ecart cours / (MMA50) +6,83% Ecart cours / (MMA100) +7,19%
Les plus fortes hausses du
|
|
|
|
+1,39%
|
|
|
+0,52%
|
Les plus fortes baisses du
|
|
|
|
-0,95%
|
|
|
-1,05%
|
|
|
-1,50%
|
|
|
-4,30%
|
|
|
-4,91%
|
|
|
-4,92%
|
|
|
-5,20%
|
|
|
-7,14%
|
Voir le palmarès
| 
 BVP NASDAQ EMERGING CLOUD INDEX
