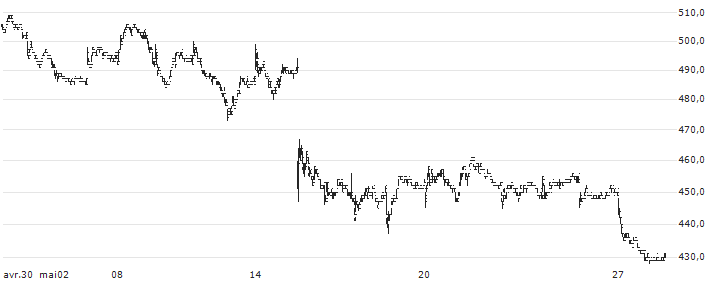
|
Marché Fermé -
Japan Exchange
08:00:00 02/05/2024
|
Varia. 5j.
|
Varia. 1 janv.
|
|
485
JPY
|
-1,22%
|
 |
-4,15%
|
-12,93%
|

| |
26/04/2024
|
30/04/2024
|
01/05/2024
|
02/05/2024
|
| Dernier |
506 ¥
|
502 ¥
|
491 ¥
|
485 ¥
|
| Volume |
174 500 |
154 000 |
192 100 |
197 600 |
| Variation |
+1,20%
|
-0,79%
|
-2,19%
|
-1,22%
|
| Ouverture |
500.00 |
508.00 |
500.00 |
491.00 |
| Plus haut |
507.00 |
509.00 |
500.00 |
492.00 |
| Plus bas |
497.00 |
501.00 |
491.00 |
485.00 |
Volume du jour estimé
197 600
Volume moy. 20 séances
194 915
Ratio Volume du jour
1.01
Volume moy. 20 séances JPY
94 533 775.00
Volume moy. 20 séances USD
617 683.69
Volume record 1
25 303 200
Volume record 2
23 790 400
Volume record 3
20 385 600
Rotation capital moyenne
0.00
Rotation flottant moyenne
0.00
Capitalisation (JPY)
52 504 942 608
Capitalisation (USD)
343 067 295
Chiffre d'affaires (JPY)
33 969 000 000
Chiffre d'affaires (USD)
221 953 446
CA / Employé (JPY)
23 108 163
CA / Employé (USD)
150 989
Capitalisation flottante (JPY)
20 049 231 363
Capitalisation flottante (USD)
131 001 678
Capital Moyen Quotidien Echangé
0.18%
Moyenne mobile 5 jours
496.00
Moyenne mobile 20 jours
501.15
Moyenne mobile 50 jours
552.52
Moyenne mobile 100 jours
558.37
Ecart cours / (MMA5) +2,27% Ecart cours / (MMA20) +3,33% Ecart cours / (MMA50) +13,92% Ecart cours / (MMA100) +15,13% | Nom |
Varia.
|
Varia. 5j.
|
Varia. 1 janv.
|
Varia. 1an
|
Capi.
|
|---|
| | -1,22% | -4,15% | -12,93% | +0,83% | 343 M | | | -0,09% | +2,91% | +14,61% | +80,41% | 68,85 Md | | | +1,39% | +0,11% | +0,83% | +11,54% | 43,23 Md | | | -0,78% | -4,34% | -14,97% | +7,30% | 5,11 Md | | | +0,05% | -0,02% | +1,98% | +17,38% | 2,24 Md | | | 0,00% | -7,94% | -29,29% | -19,29% | 1,83 Md | | | -0,61% | -2,02% | +3,63% | +28,54% | 1,48 Md | | | +0,11% | 0,00% | +0,46% | +25,13% | 1,44 Md | | | -4,68% | -10,26% | -29,73% | -32,87% | 1,16 Md | | | -1,96% | -3,71% | -17,07% | +0,88% | 1,11 Md | | | -1,06% | -2,10% | +33,59% | +26,60% | 848 M | | | +3,26% | +1,32% | +6,55% | +49,50% | 807 M | | | -1,68% | -9,75% | +0,80% | +26,66% | 756 M | | | +15,91% | +27,50% | +114,29% | +117,02% | 844 M | | | +0,10% | +4,38% | -24,95% | -49,09% | 564 M | | | -0,81% | +5,17% | -2,24% |
-
| 488 M | | Moyenne | +0,50% | +0,35% | +2,85% | +19,37% | | | Moyenne pondérée par Capi. | +0,42% | +2,37% | +7,48% | +48,02% | |
f73d1e41f4b037dfbcf1487aeca0e.nJB9waq5zyUkzCx4RqbSOItTgrMvYWcvwodYhkDOliA.z6Yl9-f_-XRRvxwVFou9dbog0td4OTNtl7cHxwibonD33SmH8-CIXUadQw | Date | Cours | Volume | Volume du jour |
|---|
|
08:00:00 |
485
|
38 000 |
197 600 | |
07:59:56 |
485
|
200 |
159 600 | |
07:59:25 |
485
|
100 |
159 400 | |
07:59:24 |
485
|
200 |
159 300 | |
07:59:24 |
485
|
100 |
159 100 | |
07:59:24 |
487
|
100 |
159 000 | |
07:59:24 |
486
|
100 |
158 900 | |
07:59:24 |
486
|
100 |
158 800 | |
07:59:24 |
486
|
600 |
158 700 | |
07:59:23 |
486
|
500 |
158 100 |
| 
