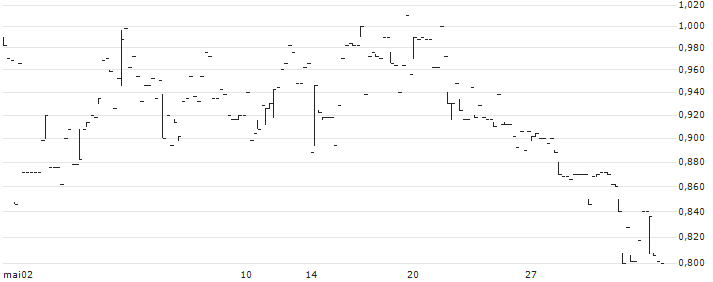
|
Marché Fermé -
Nasdaq Stockholm
17:06:24 03/05/2024
|
Varia. 5j.
|
Varia. 1 janv.
|
|
0,952
SEK
|
-1,65%
|
 |
+2,37%
|
-20,67%
|

| |
29/04/2024
|
30/04/2024
|
02/05/2024
|
03/05/2024
|
| Dernier |
0.926 kr
|
0.938 kr
|
0.968 kr
|
0.952 kr
|
| Volume |
6 245 |
124 179 |
142 413 |
486 287 |
| Variation |
-0,43%
|
+1,30%
|
+3,20%
|
-1,65%
|
| Ouverture |
0.86 |
0.85 |
0.99 |
0.85 |
| Plus haut |
0.93 |
1.02 |
0.99 |
1.00 |
| Plus bas |
0.86 |
0.85 |
0.93 |
0.85 |
Volume du jour estimé
486 287
Volume moy. 20 séances
126 603
Ratio Volume du jour
3.84
Volume moy. 20 séances SEK
120 526.06
Volume moy. 20 séances USD
11 150.47
Rotation capital moyenne
0.00
Rotation flottant moyenne
0.00
Capitalisation (SEK)
143 558 796
Capitalisation (USD)
13 281 342
Chiffre d'affaires (SEK)
798 500 000
Chiffre d'affaires (USD)
73 873 228
CA / Employé (SEK)
16 989 362
CA / Employé (USD)
1 571 771
Capitalisation flottante (SEK)
86 095 127
Capitalisation flottante (USD)
7 965 091
Capital Moyen Quotidien Echangé
0.08%
Moyenne mobile 5 jours
0.95
Moyenne mobile 20 jours
1.03
Moyenne mobile 50 jours
1.16
Moyenne mobile 100 jours
1.31
Ecart cours / (MMA5) -0,63% Ecart cours / (MMA20) +8,51% Ecart cours / (MMA50) +21,89% Ecart cours / (MMA100) +38,01% | Nom |
Varia.
|
Varia. 5j.
|
Varia. 1 janv.
|
Varia. 1an
|
Capi.
|
|---|
| | -1,65% | +2,37% | -20,67% | -65,38% | 13,28 M | | | +2,15% | +1,59% | +29,21% | +24,25% | 5,16 Md | | | -1,75% | -1,28% | -16,03% | +15,89% | 3,48 Md | | | +1,08% | -2,31% | +37,18% | +42,55% | 3,19 Md | | | -1,11% | +6,86% | +52,88% | +91,68% | 1,6 Md | | | +1,62% | +0,20% | +14,53% | +51,16% | 939 M | | | -0,14% | -4,53% | -5,03% | -27,75% | 687 M | | | +1,28% | -1,35% | +7,68% | +21,71% | 550 M | | | +1,93% | +2,40% | +4,19% | +6,04% | 206 M | | | 0,00% | +0,52% | -20,45% | -22,22% | 112 M | | Moyenne | +0,34% | +1,23% | +8,35% | +13,79% | | | Moyenne pondérée par Capi. | +0,57% | +1,05% | +19,50% | +31,49% | |
34044e1e.J9f1TLl0F6abeVEyskVlL55M4CmS-Sq9-7EBirHTUOc.F6KaB95BfcTZS3wAhD1VfKY0smD-kBLMitl38-CrE6B1sYA14ENH6sQwMg | Date | Cours | Volume | Volume du jour |
|---|
|
17:06:24 |
0,952
|
18 900 |
486 287 | |
17:03:39 |
0,946
|
3 112 |
467 387 | |
16:52:05 |
0,946
|
506 |
464 275 | |
16:52:05 |
0,946
|
1 017 |
463 769 | |
16:52:05 |
0,946
|
12 143 |
462 752 | |
16:12:41 |
0,932
|
2 363 |
450 609 | |
16:12:41 |
0,932
|
13 666 |
448 246 | |
16:09:46 |
0,954
|
18 500 |
434 580 | |
16:04:22 |
0,972
|
12 843 |
416 080 | |
16:00:55 |
0,962
|
18 900 |
403 237 |
| 
