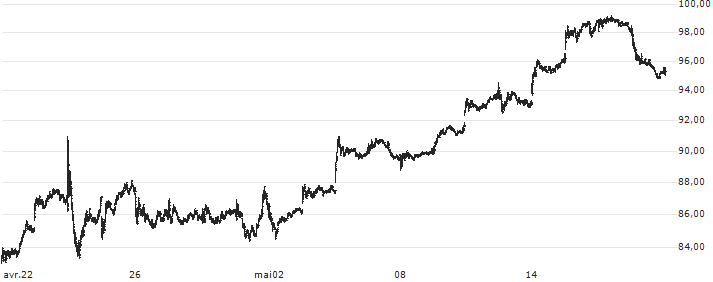
|
Marché Fermé -
Nasdaq
22:00:00 26/04/2024
|
Varia. 5j.
|
Varia. 1 janv.
|
|
86,04
USD
|
-1,40%
|
 |
+4,34%
|
+0,78%
|

| |
23/04/2024
|
24/04/2024
|
25/04/2024
|
26/04/2024
|
| Dernier |
86.53 $
|
87.11 $
|
87.26 $
|
86.04 $
|
| Volume |
6 008 699 |
7 274 505 |
3 166 460 |
3 637 434 |
| Variation |
+1,58%
|
+0,67%
|
+0,17%
|
-1,40%
|
| Ouverture |
85.65 |
87.56 |
85.90 |
87.61 |
| Plus haut |
87.62 |
91.00 |
88.13 |
87.70 |
| Plus bas |
85.61 |
83.34 |
84.46 |
85.15 |
Volume du jour estimé
3 637 434
Volume moy. 20 séances
3 285 418
Ratio Volume du jour
1.11
Volume moy. 20 séances USD
282 677 364.72
Volume record 1
89 629 980
Volume record 2
85 933 650
Volume record 3
75 408 780
Rotation capital moyenne
0.02
Rotation flottant moyenne
0.02
Capitalisation (USD)
18 026 303 123
Chiffre d'affaires (USD)
7 384 000 000
CA / Employé (USD)
221 078
Capitalisation flottante (USD)
17 925 058 478
Capital Moyen Quotidien Echangé
1.57%
Moyenne mobile 5 jours
86.42
Moyenne mobile 20 jours
87.59
Moyenne mobile 50 jours
89.17
Moyenne mobile 100 jours
86.86
Ecart cours / (MMA5) +0,44% Ecart cours / (MMA20) +1,80% Ecart cours / (MMA50) +3,64% Ecart cours / (MMA100) +0,95% | Nom |
Varia.
|
Varia. 5j.
|
Varia. 1 janv.
|
Varia. 1an
|
Capi.
|
|---|
| | -1,40% | +4,34% | +0,78% | +51,48% | 18,03 Md | | | +0,12% | +8,87% | +63,48% | +192,20% | 89,27 Md | | | -0,46% | +0,68% | -6,95% | -5,79% | 27,4 Md | | | +1,18% | +2,26% | +1,12% | +20,41% | 22,32 Md | | | +0,67% | +2,37% | -8,90% | +43,26% | 12,3 Md | | | +0,05% | +3,64% | +9,13% | +33,47% | 10,03 Md | | | +0,89% | -1,74% | +14,60% | +145,65% | 9,94 Md | | | +1,70% | +1,33% | -14,40% | +49,64% | 9,54 Md | | | +5,43% | +4,30% | +17,98% | -3,16% | 9,41 Md | | | +2,43% | +2,32% | +11,11% | +39,37% | 7,92 Md | | | +3,55% | +1,90% | +90,79% | +318,24% | 7,54 Md | | | +1,61% | +5,10% | -13,68% | +37,79% | 7,14 Md | | | +0,10% | +0,09% | +3,14% | +53,06% | 5,95 Md | | | +1,72% | +1,03% | +11,09% | +124,71% | 5,76 Md | | | +3,63% | +4,90% | -6,92% | -17,22% | 4,19 Md | | | +0,65% | +1,30% | -23,53% | +7,59% | 4,04 Md | | Moyenne | +1,37% | +4,29% | +9,30% | +68,17% | | | Moyenne pondérée par Capi. | +0,68% | +5,40% | +25,15% | +100,15% | |
4711c16b786e4dfe5ed.Ul40jLe_NlpaFXpJfDb6kKceh9rmP4_roQOKBXA7wvc.OA4CueDgXwpvURklPnWR18x7wZvUecuq-TbecDFxss5jCVq73olDEQ1WEQ | Date | Cours | Volume | Volume du jour |
|---|
|
22:00:00 |
86,04
|
281 942 |
2 711 066 | |
22:00:00 |
85,99
|
180 |
2 429 124 | |
22:00:00 |
85,99
|
1 100 |
2 428 944 | |
21:59:59 |
86
|
100 |
2 427 844 | |
21:59:59 |
85,99
|
400 |
2 427 744 | |
21:59:59 |
85,99
|
100 |
2 427 344 | |
21:59:59 |
86
|
173 |
2 427 244 | |
21:59:59 |
86
|
100 |
2 427 071 | |
21:59:59 |
86
|
100 |
2 426 971 | |
21:59:58 |
85,99
|
100 |
2 426 871 |
| 
