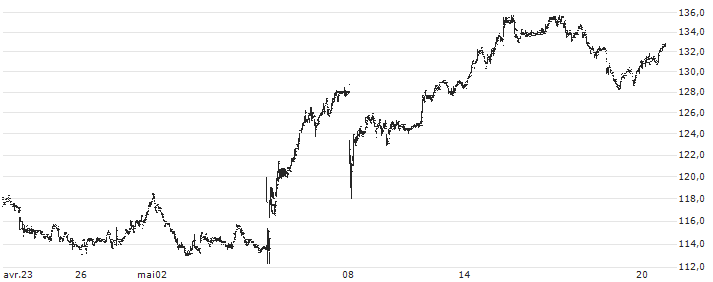
|
Marché Fermé -
Nasdaq Stockholm
17:29:35 26/04/2024
|
Varia. 5j.
|
Varia. 1 janv.
|
|
115,2
SEK
|
+1,23%
|
 |
-3,60%
|
+13,83%
|

| |
23/04/2024
|
24/04/2024
|
25/04/2024
|
26/04/2024
|
| Dernier |
117.2 kr
|
114.5 kr
|
113.8 kr
|
115.2 kr
|
| Volume |
29 073 |
51 438 |
85 757 |
56 120 |
| Variation |
+0,51%
|
-2,30%
|
-0,61%
|
+1,23%
|
| Ouverture |
120.00 |
117.00 |
114.50 |
113.10 |
| Plus haut |
120.00 |
117.00 |
115.70 |
115.20 |
| Plus bas |
116.80 |
114.50 |
113.50 |
113.10 |
Volume du jour estimé
56 120
Volume moy. 20 séances
88 914
Ratio Volume du jour
0.63
Volume moy. 20 séances SEK
10 242 892.80
Volume moy. 20 séances USD
936 282.35
Volume record 1
16 649 230
Volume record 2
4 026 695
Volume record 3
3 735 945
Rotation capital moyenne
0.00
Rotation flottant moyenne
0.00
Capitalisation (SEK)
11 607 497 670
Capitalisation (USD)
1 061 018 147
Chiffre d'affaires (SEK)
1 296 506 000
Chiffre d'affaires (USD)
118 511 020
CA / Employé (SEK)
6 173 838
CA / Employé (USD)
564 338
Capitalisation flottante (SEK)
9 292 910 635
Capitalisation flottante (USD)
849 446 375
Capital Moyen Quotidien Echangé
0.09%
Moyenne mobile 5 jours
115.46
Moyenne mobile 20 jours
118.55
Moyenne mobile 50 jours
123.90
Moyenne mobile 100 jours
115.16
Ecart cours / (MMA5) +0,23% Ecart cours / (MMA20) +2,91% Ecart cours / (MMA50) +7,55% Ecart cours / (MMA100) -0,04% | Nom |
Varia.
|
Varia. 5j.
|
Varia. 1 janv.
|
Varia. 1an
|
Capi.
|
|---|
| | +1,23% | -3,60% | +13,83% | +12,61% | 1,06 Md | | | -1,85% | +1,41% | -4,66% | -10,10% | 86,13 Md | | | -1,28% | -1,41% | +1,32% | -1,03% | 39,82 Md | | | +3,18% | +7,47% | -19,27% | -28,88% | 30,42 Md | | | +0,65% | +2,76% | +57,86% | +45,60% | 25,23 Md | | | -1,53% | -8,71% | -16,09% | -12,48% | 15,36 Md | | | +7,67% | +2,31% | -9,14% | -8,99% | 11,95 Md | | | +0,98% | -1,28% | -17,69% | -29,83% | 11,6 Md | | | +1,81% | -13,98% | -43,00% | -36,22% | 11,51 Md | | | +0,07% | +7,66% | +5,24% | +11,07% | 8,71 Md | | | +1,56% | +17,92% | -8,42% | +0,64% | 8,12 Md | | | +1,57% | +1,23% | +2,29% | +18,41% | 7,72 Md | | | 0,00% | +3,15% | +76,35% | +292,10% | 6,69 Md | | | -0,96% | +2,57% | -10,12% | +14,67% | 6,59 Md | | | -0,80% | -0,49% | -7,72% | +5,66% | 6,49 Md | | | +4,03% | +4,90% | -16,71% | -39,77% | 6,05 Md | | Moyenne | +1,02% | +1,24% | +0,25% | +14,59% | | | Moyenne pondérée par Capi. | +0,15% | +0,95% | -0,81% | +1,42% | |
17f56808ac98b2cc3fe021e967c516a.PpktyLlH97ThjAg4Rn14L-XRTqNLiMPgBjY91huExn8.Ucp1u_Z0j9uMzmZvGREcR9SbHpAcyvGrblR3nl3qtRdUrHKljwbFx4LbMA | Date | Cours | Volume | Volume du jour |
|---|
|
17:29:35 |
115,2
|
81 |
56 117 | |
17:29:35 |
115,2
|
27 |
56 036 | |
17:29:35 |
115,2
|
109 |
56 009 | |
17:29:35 |
115,2
|
273 |
55 900 | |
17:29:35 |
115,2
|
183 |
55 627 | |
17:29:35 |
115,2
|
187 |
55 444 | |
17:29:35 |
115,2
|
109 |
55 257 | |
17:29:35 |
115,2
|
54 |
55 148 | |
17:29:35 |
115,2
|
273 |
55 094 | |
17:29:35 |
115,2
|
369 |
54 821 |
| 
