








Instrument Inactif
Société Chembio Diagnostics, Inc.
Actions
CEMI
US1635722093
Produits pharmaceutiques
Description de l'Activité: Chembio Diagnostics, Inc.

Nombre d'employés: 188
Répartition des Ventes par Activité: Chembio Diagnostics, Inc.
| Période Fiscale: Décembre | 2019 (USD) | 2020 (USD) | 2021 (USD) | 2022 (USD) |
|---|---|---|---|---|
Rapid Medical Tests | 34,46 M | - | 47,82 M | 49,52 M |
Répartition Géographique des Ventes: Chembio Diagnostics, Inc.
| Période Fiscale: Décembre | 2019 (USD) | 2020 (USD) | 2021 (USD) | 2022 (USD) |
|---|---|---|---|---|
Latin America | 11,81 M | 9,84 M | 18,42 M | 19,27 M |
United States | 7,7 M | 7,01 M | 17,99 M | 18,07 M |
Africa | 7,56 M | 4,89 M | 5,56 M | 7 M |
Europe & Middle East | 6,5 M | 9,91 M | 5,18 M | 4,52 M |
Asia | 889 k | 824 k | 665 k | 665 k |
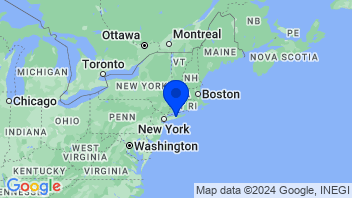
Coordonnées de la Société: Chembio Diagnostics, Inc.
Fabricants de diagnostiques et substances d'analyses
Ajouter à une liste 0 sélectionné | Varia. | Varia. 5j. | Varia. 1an | Varia. 3ans | Capi.($) | |
|---|---|---|---|---|---|---|
 | -0,79% | -1,43% | +46,25% | +138,46% | 1 216 Md | |
| +1,43% | +0,37% | +48,51% | +82,52% | 656 Md | |
| +1,07% | +0,18% | +34,39% | +105,99% | 509 Md | |
| -0,36% | -2,84% | +47,23% | +64,51% | 384 Md | |
| -0,14% | +0,27% | +73,87% | +41,93% | 362 Md | |
| -0,78% | +0,59% | +31,01% | +59,68% | 311 Md | |
| -0,80% | +6,73% | +11,89% | +35,64% | 293 Md | |
| +0,03% | -0,07% | +43,94% | +70,61% | 249 Md | |
| -0,41% | +0,77% | +36,15% | +104,55% | 208 Md | |
| Moyenne | -0,08% | +0,60% | +41,47% | +78,21% | 465,31 Md | |
| Moyenne pondérée par Capi. | -0,05% | +0,03% | +43,46% | +91,86% |


